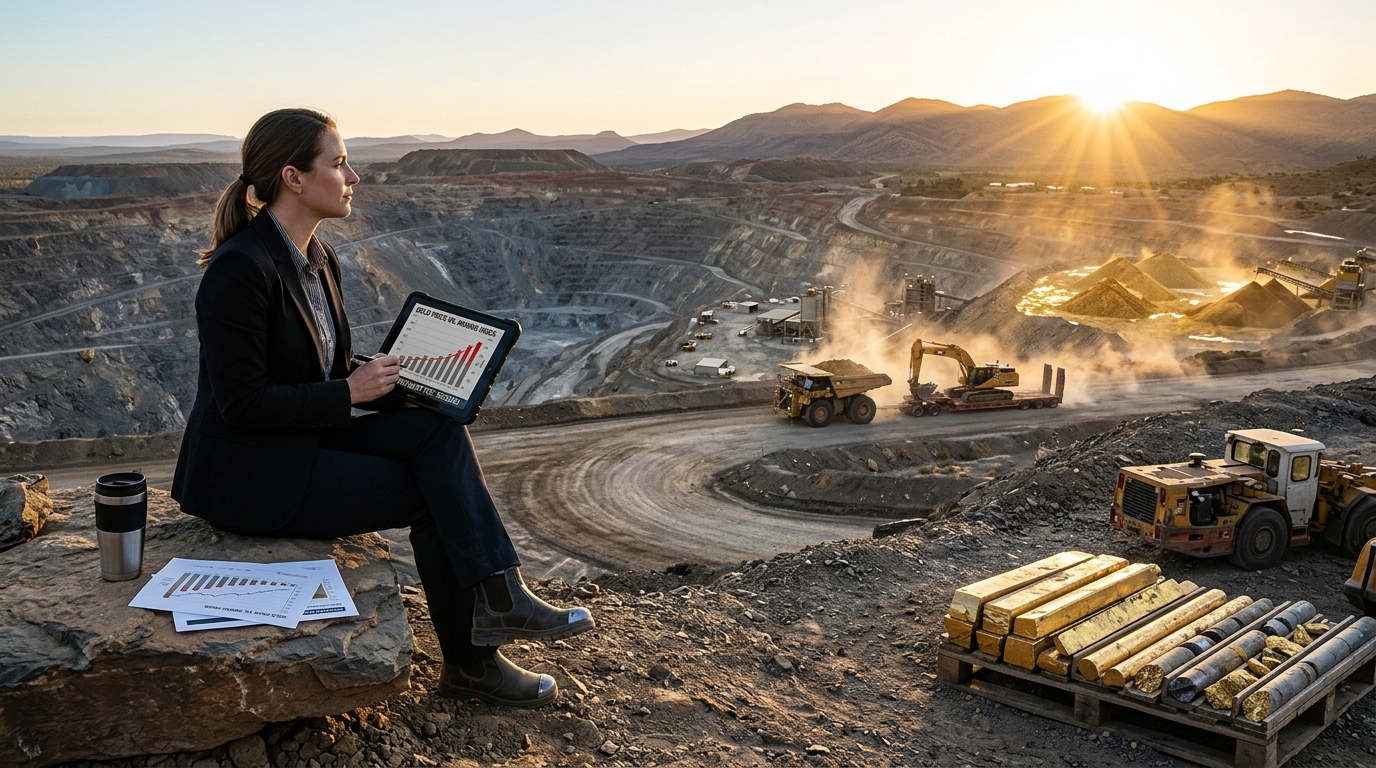
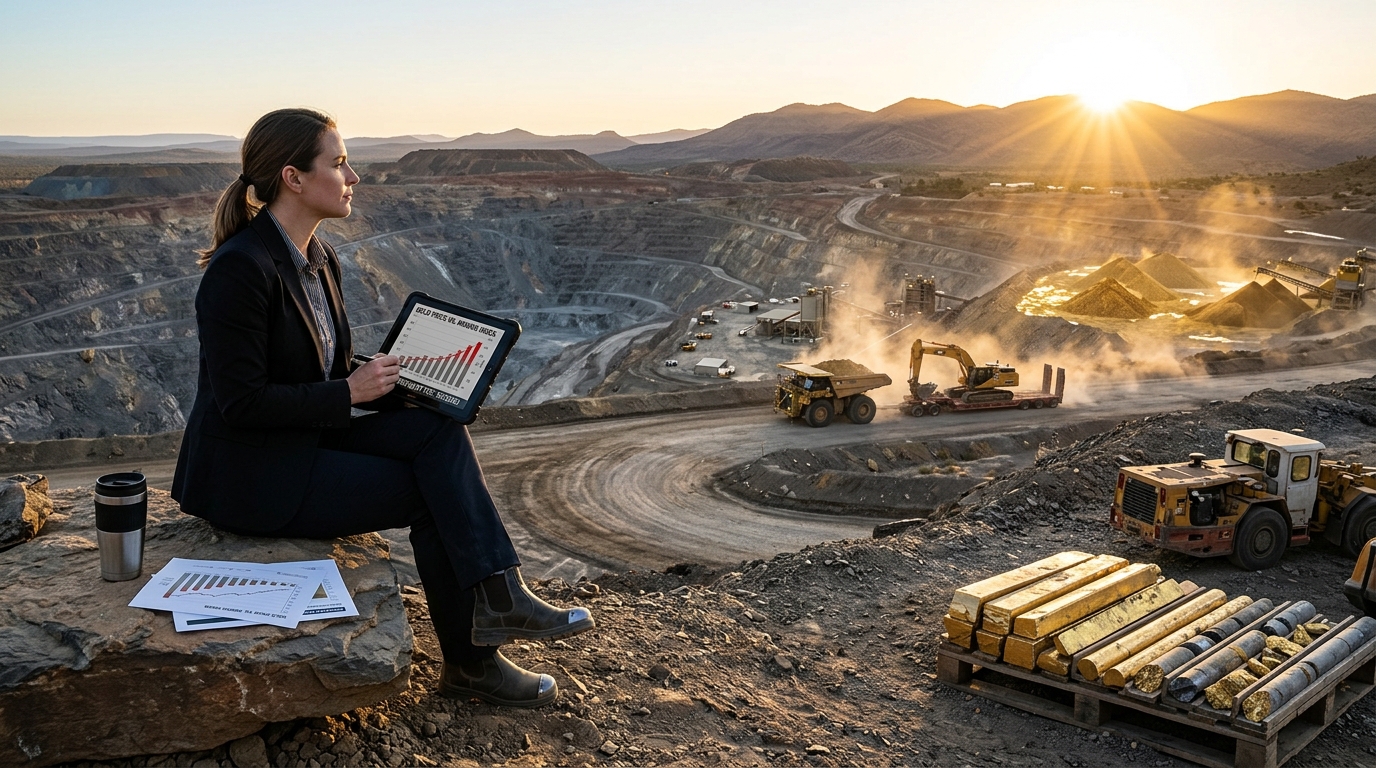
Gold crossed $5,300 an ounce earlier this year. It has since pulled back below the $5,000 mark. And somehow, the stocks that dig it out of the ground are still being treated like an afterthought.
That’s the part worth paying attention to right now.
Where Gold Stands
The price of gold hit a new all-time high in early 2026, rising above $5,300 an ounce on several occasions, driven by geopolitical uncertainty, anxiety about U.S. tariff threats, and volatility in the value of the dollar.
In 2025 alone, gold notched dozens of new all-time highs and returned about 67% for the full year — one of its strongest annual performances in decades.
Persistent central bank buying and ongoing debate about reserve diversification have acted as supports. J.P. Morgan Global Research has projected gold could average about $5,055/oz by Q4 2026 and has highlighted central bank demand as a key driver. At Newmont’s Q1 realized gold price of about $4,900/oz, the company is already operating near those forecast levels.
The pullback from the high has cooled some of the enthusiasm. That is precisely when the underlying math becomes interesting.
Newmont: The Numbers Are Not Close to Subtle
The world’s largest gold producer just posted one of the most remarkable single-quarter results in the company’s history.
- Q1 2026 Revenue: $7.31B, up 46% year-over-year
- Free Cash Flow: $3.1B — an all-time quarterly record, even after $1.3B in cash tax payments
- Adjusted EBITDA: $5.2B
- Net Income: $3.3B
- Gold By-Product AISC: $1,029/oz vs. realized price of about $4,900/oz — a spread that explains almost everything
- Shareholder Returns: $2.7B returned via dividends and buybacks since the last earnings call
- New Buyback Authorization: $6.0B
- Cash Position: about $8.8B at quarter-end
- Full-Year 2026 Production Guidance: 5.3M attributable oz gold
The operating leverage here is not accidental. Fixed production costs mean that higher gold prices translate into disproportionately larger profit margins per ounce — earnings grow faster than production volume. That dynamic is what makes gold equities different from the physical metal in a sustained bull market.
Why Gold Stocks Still Look Underpriced
Here’s what’s strange. Gold has been climbing for three years. Mining stocks have moved, but they have not kept pace with the cash generation. Newmont’s Q1 gold by-product AISC was $1,029 per ounce. With realized pricing around $4,900 in Q1, that spread is generating free cash flow that would look extraordinary in any sector.
A few reasons the market has been slow to re-rate:
- Sector familiarity gap — institutional allocators spent three years chasing AI, not commodities
- Production volume decline at Newmont in Q1 2026 (about 1.3M attributable oz) created noise in the headline numbers
- Gold itself pulled back below $5,000, temporarily reducing conviction on price durability
- Geopolitical catalysts — which drove much of the rally — are not the kind of tailwind funds want to publicly underwrite
Worth saying plainly: Newmont cited a seismic event at Cadia as a factor weighing on near-term production, with rehabilitation expected to complete in roughly five weeks and a full recovery by the end of Q2. The company also indicated that production is weighted to the second half of 2026, which means the best output numbers are still ahead.
The Broader Miner Landscape
Newmont is the blue-chip name, but the trade is not limited to one company.
Barrick Mining (NYSE: B) has guided to 2026 gold production of 2.9M–3.25M ounces and has implemented a dividend policy targeting a total payout of 50% of attributable free cash flow on an annualized basis (with a fixed base quarterly dividend and a year-end performance top-up component).
Agnico Eagle, one of the world’s largest gold producers, operates mines in Canada, Australia, Finland, and Mexico — jurisdictions viewed as among the most stable in global mining. Operational efficiency and disciplined cost control have made it a consistent performer regardless of where gold trades.
On the royalty and streaming side, Franco-Nevada and Wheaton Precious Metals offer exposure to gold prices without direct operational risk — no mine-level cost blowouts, no labor disputes, just royalty income flowing from other people’s production.
Bull / Base / Bear
Bull: Gold holds above $4,500 through year-end, Newmont’s H2 production ramp delivers on guidance, and institutional rotation from AI-adjacent names into real assets accelerates. The free cash flow story gets the attention it deserves.
Base: Gold trades sideways in the $4,500–$5,000 range. Miners continue generating substantial cash but re-rating is slow. Buybacks and dividends become the primary return mechanism.
Bear: A stronger-than-expected dollar, surprise Fed hawkishness, or a meaningful geopolitical de-escalation reduces safe-haven demand. Gold tests $4,000. Margins compress and the trade loses its near-term catalyst.
Technical Overlay
Gold itself found support in the $4,600–$4,700 zone after pulling back from the $5,300 high. Senior miners like NEM and B have consolidating bases after significant runs — which historically precedes the next leg higher rather than a structural reversal. The GDX (VanEck Gold Miners ETF) holds about $24.4 billion in assets as of June 12, 2026 and currently holds 69 positions, and its performance tends to lag and then overshoot the metal in extended bull cycles.
What Investors Should Watch
- Gold spot price: The entire thesis lives and dies here. Watch $4,500 as the floor that keeps the math intact.
- Newmont Q2 results: Production is expected to be lower due to the Cadia recovery — but free cash flow generation at these prices should remain substantial.
- Central bank buying: Central banks remained major net buyers of gold through 2025 and into 2026 as part of efforts to diversify reserves, and that demand typically does not reverse overnight.
- Sector rotation: Any meaningful shift from growth/tech into real assets would be a powerful catalyst for the entire mining complex.
Bottom Line
Gold miners are generating more cash per ounce of production than at almost any point in history. The spread between costs and realized prices is wide. Buybacks are aggressive. Balance sheets are the strongest they have been in a decade. The market just hasn’t fully priced the earnings power that exists at current gold levels — and that gap is the trade.
The metal pulled back. The free cash flow didn’t.
For informational purposes only.