April 27, 2026
The Strait of Hormuz Is Closed — Here’s What Traders Need to Know
The largest energy supply disruption in market history is live. This is what’s moving, what’s breaking, and how disciplined traders are thinking about it.

Let’s get right to it. The Strait of Hormuz — the narrow chokepoint that funnels roughly 20–25% of the world’s seaborne crude oil and 20% of global LNG — has been effectively closed since late February 2026. That’s not a tail risk anymore. It’s the operating environment.
The market hasn’t fully priced what this means if it persists through summer. Most investors are still treating this like a geopolitical headline that fades. It might not.
‘Please, Please, Please’: OpenAI CEO Sam Altman Begs Small Company for Help
As reported by Financial Times, those are the exact words OpenAI CEO Sam Altman spoke on an open line to a small company in Arapahoe County, Colorado… which now controls what could be the most important technology in the world. Altman is desperate to get his hands on it… and he’s not alone. This tech is now backed by Elon Musk, Jensen Huang, and more.
Click here to learn how you could invest in this breakthrough alongside Sam Altman and Elon Musk.
Key Levels & Data Points
- Brent crude hit $126/bbl at its peak — surpassing $100 on March 8 for the first time in four years — with physical prices reportedly reaching near $150/bbl as oil-importing nations scrambled for replacement barrels
- WTI was trading around $96.36 as of April 27, still up ~27% since the start of the conflict, with Brent at $107.58
- S&P 500 Energy sector gained +38.2% in Q1 2026 — the standout performer by a wide margin — while the S&P 500 itself fell -4.3% and the Nasdaq dropped -7.0%
- March CPI came in at 3.3% year-over-year, up sharply from February’s 2.4%, significantly complicating the Fed’s rate path
- Crude oil flows through the Strait plunged from ~20 million barrels per day before the war to just over 2 mb/d in March — a drop of roughly 90%
- Gulf countries have cut total oil production by more than 14 mb/d as storage filled with landlocked crude that could not exit the strait
- Analysts at FactSet are projecting Energy sector earnings growth of 71% for Q2 2026, followed by 42.1% in Q3 and 40.9% in Q4 — sustained, not a one-quarter spike
- The forward 12-month P/E for the S&P 500 stands at 20.9x, above both the 5-year average of 19.9x and the 10-year average of 18.9x — valuations that leave thin margin for error
Editor’s note: Please see the following from Professor Joel Litman, a former consultant to the Pentagon and FBI, who just flew a small helicopter near one of the most secure sites in America to uncover what he says could soon become the biggest stock market story of 2026…
Potential $10 Trillion Breakthrough
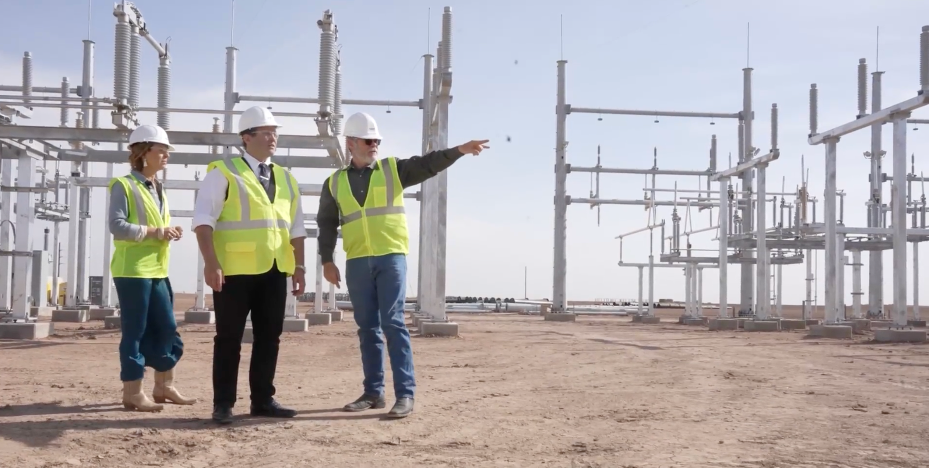
I just traveled halfway around the world to one of the most remote and possibly dangerous sites in America… to witness a potential $10 trillion technology backed by Elon Musk and Sam Altman.
The site I visited is in an area marked as a “top 7 nuclear target” by Russia – alongside Camp David and the Pentagon.
And every morning, at 6 a.m., you may hear bombs going off.
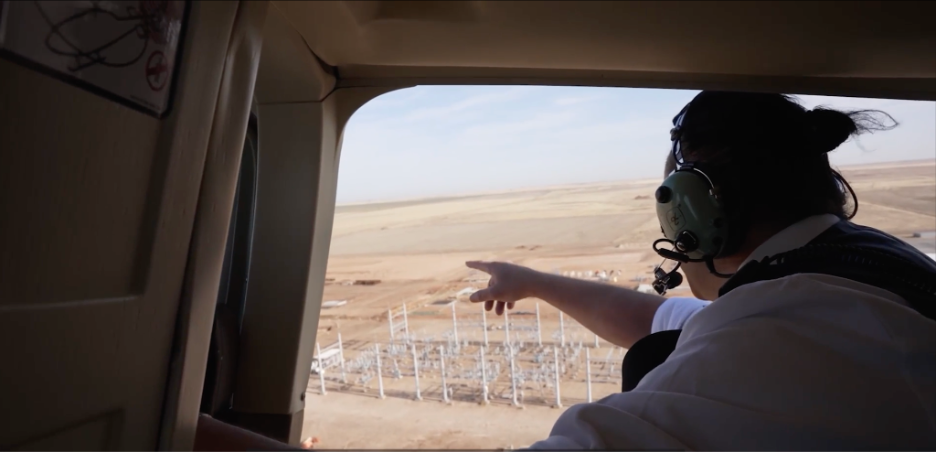
This is me flying in on a small helicopter…

You’d be arrested if you got too close to this place…
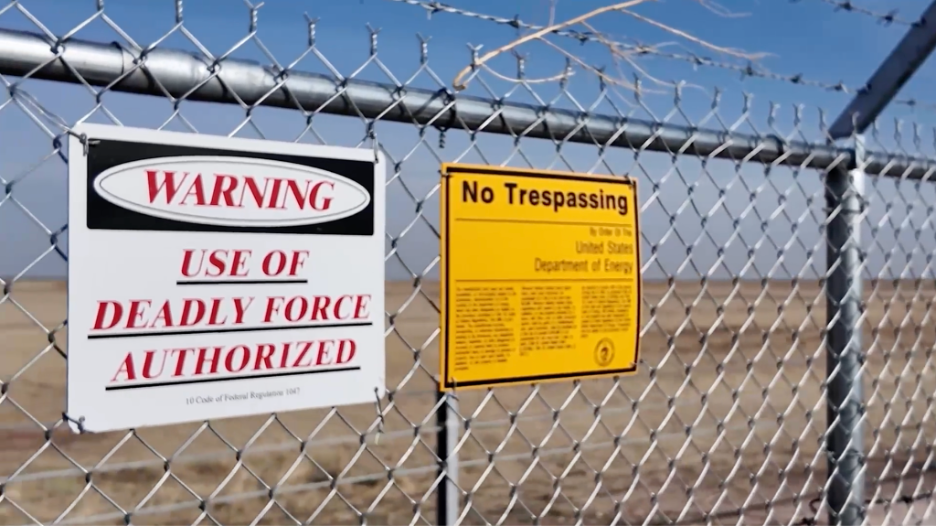
But I got special permission to enter… because I know what’s hiding in plain sight there…
And it’s quickly becoming one of the most sought-after products in the world, with “years-long” backlogs already forming.
The Financial Times reports that Sam Altman has been begging a small company over the phone to build this for him.
This is supported by Meta, Google parent Alphabet, Amazon, and Nvidia CEO Jensen Huang…
And even President Trump has stepped in to greenlight this underlying technology with an emergency executive order.
But most importantly for you…
I believe the stocks involved in this could soar in the days ahead as this news breaks.
That’s because no one – not even Elon Musk – can get their hands on this without going through a small group of little-known companies that own the rights to this technology.
You could back these companies right now, in your regular brokerage account – before this goes mainstream.
I’m sharing all the details on the ground at this heavily secured site in West Texas, where this technology is about to go live…
Click here to see my full report.
Regards,
Joel Litman
Chief Investment Officer, Altimetry
P.S. I’m sharing the name of the company that Sam Altman has asked to build this tech for OpenAI – for free.
Macro Context — Why This Moment Is Different
The sequence of events matters here. In late February 2026, the United States and Israel launched an air campaign against Iran and, in the process, assassinated Supreme Leader Ali Khamenei. Iran’s response was swift and consequential: missile and drone attacks on US military bases, Gulf states, and Israel — and, critically, the closure of the Strait of Hormuz to commercial shipping. The Iranian Revolutionary Guard Corps issued formal warnings, boarded vessels, and laid sea mines. By mid-April, the US had established a blockade of Iranian ports, creating what analysts are now calling a “dual blockade” — both sides effectively sealed off the waterway.
The IEA has characterized this as the largest supply disruption in the history of the global oil market. The head of the IEA went further, calling it the “greatest global energy security challenge in history.” Those are not phrases thrown around casually by central-bank-adjacent institutions.
Slight tangent, but it matters: this didn’t emerge in a vacuum. The 2026 environment was already stressed heading into this. Tariff-driven inflation from the US-China trade war had pushed consumer prices higher across goods categories. The Trump tariffs — now estimated to represent the largest US tax increase as a percent of GDP since 1993, amounting to an average of approximately $1,500 per household in 2026 — were already pressuring margins. Add a 27% gasoline price spike on top of that, and the consumer stress picture looks considerably less benign than ISM readings alone would suggest.
The Fed is stuck. March CPI at 3.3% — far above February’s 2.4% — has essentially frozen any credible rate cut scenario. Futures markets are now pricing roughly a 1-in-3 chance of any cut in 2026. A labor market reading of -92,000 payrolls with unemployment at 4.4% is not a recessionary print, but it’s also not the backdrop that lets policymakers look away from energy inflation. The Fed faces stagflationary pressure, which is historically the hardest environment to navigate from a policy standpoint.
Sector Breakdown — Who’s Winning, Who’s Bleeding
Energy is the obvious beneficiary, and the magnitude of the outperformance is worth sitting with. A +38.2% Q1 gain in the S&P 500 Energy sector — against a broader index down -4.3% — represents one of the sharpest instances of sector divergence in recent memory. The sector now carries a 7% free cash flow yield compared to roughly 4% for the total market, which, combined with oil prices above $96 WTI, supports continued capital returns to shareholders even if prices cool modestly from recent highs.
ExxonMobil (XOM), Chevron (CVX), and ConocoPhillips (COP) remain the largest constituents by weight. The integrated majors benefit from balanced upstream/downstream exposure, but the real earnings torque in this environment sits with pure-play E&P names — Oil & Gas Refining & Marketing, for instance, is projected to report year-over-year earnings growth from -$125 million to $1.9 billion for Q1 2026. That’s not a small number. Oil & Gas Storage & Transportation is projected up 27% year-over-year as well, as landlocked crude desperately needs infrastructure to move.
Meanwhile, Big Tech is getting hit from multiple angles. The Nasdaq’s -7.0% Q1 decline reflects a valuation reset more than an earnings collapse — Q1 blended earnings growth for the S&P 500 is tracking at 13.2%, which would mark the sixth consecutive quarter of double-digit growth. But when risk-free rates stay elevated and geopolitical uncertainty is high, investors re-price future cash flows downward. That’s what you’re seeing: not profit deterioration, but multiple compression. Markets recover more easily from valuation resets than from actual earnings decline. Worth keeping in mind.
Airlines and consumer discretionary face direct margin pressure. With WTI near $96 and jet fuel prices at elevated levels, carriers are extending flight paths to circumnavigate Middle Eastern airspace — adding fuel burn on top of already disrupted operations. Airlines serving Asia-Pacific routes are particularly exposed. Retail and consumer staples face dual headwinds: tariff-driven input cost inflation from China, and now energy-driven transport cost inflation from the Hormuz closure.
There’s a less obvious angle that deserves attention: helium. Qatar supplies over 30% of the world’s helium, and with the Strait effectively closed, those shipments are disrupted. Helium is a critical input in semiconductor fabrication — used in the cooling process for advanced GPUs. Taiwan Semiconductor Manufacturing (TSM) reportedly has reserves, but those are measured in months, not quarters. If the conflict extends into summer, semiconductor supply chains face a supply input risk that markets are not fully pricing today.
Stock-Specific Financial Framework
ExxonMobil (XOM) — As the largest contributor to Q1 Energy sector earnings estimates, XOM’s integrated model provides insulation on the downstream side when crude prices spike (refiners get squeezed when crude rises faster than product prices). That said, upstream revenue leverage to $96–$108 oil is substantial. Q1 earnings for Integrated Oil & Gas sub-industry are projected down -19% year-over-year — counterintuitively — because Q1 2025 benefited from different price dynamics. The forward quarters matter more: Q2 2026 Energy earnings growth is projected at 71.0%, driven by year-over-year oil price comparisons that become significantly more favorable.
ConocoPhillips (COP) — Pure upstream E&P exposure means COP has the most direct leverage to crude price in the large-cap space. Free cash flow generation at $96+ WTI is substantial. The company has historically maintained disciplined capital allocation — share buybacks and variable dividends — that institutional capital tends to reward in commodity upcycles. The key metric to monitor is their break-even cost per barrel; COP’s Permian and Bakken assets operate profitably well below current strip prices.
Halliburton (HAL) — Oilfield services are a derivative play on sustained production activity. If operators believe $90+ oil persists, CapEx commitments expand, which drives HAL revenue. The risk is that HAL’s earnings are more operationally leveraged and can compress fast if activity slows. Q1 results for Oil & Gas Equipment & Services sub-industry are actually projected down -13% year-over-year — a reminder that services names are not a pure oil price play in the short term.
Vistra (VST) and Constellation Energy (CEG) — The nuclear-AI power theme has gotten attention since 2025, but the Hormuz crisis adds a new dimension. With gas-fired power plants facing fuel cost pressure, utilities with nuclear baseload exposure look considerably more attractive from a cost structure standpoint. Analysts have projected 28% upside for VST, citing AI data center power contracts. CEG operates similarly. These are not traditional energy names — they’re infrastructure plays sitting at the intersection of the AI buildout and the energy shock. Worth framing that way.
Technical & Trading Framework
The S&P 500 experienced a -9% drawdown in March, with VIX spiking above 30, before recovering. The index has now essentially retraced that decline. The question for active traders isn’t whether the recovery happened — it’s whether the conditions that drove the selloff have meaningfully improved. They haven’t. Oil is still above $100 Brent. Inflation is still 3.3%. The strait is still largely closed. The rebound looks more like a relief rally on ceasefire headlines than a structural turn.
Key technical levels to monitor: The S&P 500’s 200-day moving average becomes relevant if macro data continues to soften. The energy sector (XLE) has been in a persistent uptrend since the conflict began — pull-backs toward the 20-day moving average on volume contraction have historically represented re-entry setups in trending sectors. VWAP anchored to the March lows is a useful reference for intraday positioning in energy names.
Crude oil futures structure matters here too. When physical crude prices diverge significantly from futures (as they have — with physical near $150 while futures lag meaningfully), the futures curve doesn’t fully capture supply stress. That disconnect can persist as long as the physical market remains disrupted, and it complicates hedging for both producers and consumers. The widening backwardation in crude futures signals the market expects some supply recovery — but the timeline is contested.
For the broader market, the 20.9x forward P/E is not stretched in isolation — but it is stretched given the uncertainty environment. When geopolitical risk is elevated and rate cuts are off the table, the equity risk premium should logically be higher than it is today. Risk premiums remain minimal. Complacency, or rational pricing of a short conflict resolution? That’s the central debate on the floor right now.
Scenario Modeling
Bull Case — Swift Diplomatic Resolution (Probability: Moderate)
A ceasefire that holds and produces a genuine reopening of the Strait within 60 days would be the most market-positive outcome. In this scenario: Brent crude drops back toward $75–$80, energy sector gives back a portion of its gains as rotation back into tech accelerates, CPI moderates toward 2.5–2.8% by Q3, and the Fed resumes its rate cut cycle with 50–75 bps before year-end. S&P 500 would likely push toward the 5,800–6,000 range as multiple expansion resumes. The April ceasefire was a brief window — it didn’t hold, but it showed what resolution could look like for markets.
Base Case — Prolonged Disruption with Partial Normalization (Probability: Most Likely)
The IEA’s own base case assumes a resumption of regular deliveries by mid-year — but explicitly notes this may be too optimistic. A partial reopening, where alternative Saudi and UAE pipeline capacity (estimated at 3.5–5.5 mb/d vs. pre-war flows of 20 mb/d) provides marginal relief, keeps Brent in the $90–$110 range through Q2. Inflation stays sticky in the 3.0–3.5% range. The Fed stays on hold. Earnings growth holds at 13–15% for the S&P 500 but sector rotation continues — energy, materials, and defense outperform; tech, consumer discretionary, and airlines remain under pressure. S&P 500 trades in a volatile 5,200–5,700 range.
Bear Case — Prolonged Full Closure + Escalation (Probability: Non-Trivial)
US government officials and Wall Street analysts have begun openly modeling a scenario where oil prices surge toward $200/barrel. The Dallas Fed’s research suggests a two-quarter closure of the Strait would push WTI to peak near $132/bbl and raise PCE inflation by 0.79 percentage points — a three-quarter closure raises that to 1.47 percentage points. If energy infrastructure damage in the Gulf proves more lasting — QatarEnergy has already warned that damage to its Ras Laffan LNG facility could take up to five years to repair — the supply shock becomes structural, not cyclical. In this scenario: recession risk rises materially, the Fed faces a genuine stagflation trap, consumer confidence breaks, and equities re-test or break the March lows. Credit markets become the risk to watch as private credit stress becomes visible.
Active Trader Strategy Framework
The rotation story is real and it has legs — but chasing energy after a +38% quarterly move requires discipline around entry. The sector is not cheap on an absolute basis anymore. The trade is now about managing the duration of the thesis: if the Strait remains disrupted through Q2 and Q3, Energy earnings revisions will continue to move higher (71% growth projected for Q2), which provides fundamental support even at elevated prices. If resolution comes quickly, the trade reverses fast.
A few frameworks worth considering:
- Position sizing relative to scenario probability: In an environment where the base case and bear case both involve elevated oil prices for an extended period, sizing into energy and materials while maintaining meaningful cash or defensive exposure is the institutional posture. Maximum diversification is the mode, not concentrated bets.
- Volatility as a signal, not noise: The S&P’s -9% drop in March and subsequent recovery are a template for how this market behaves. Volatility above 25–30 on VIX has historically marked better risk/reward for patient buyers of quality names — not panic sellers. The March window closed fast. A new one could open.
- Watch the Fed, not just oil: The critical macro junction is whether inflation data forces the Fed to consider rate hikes rather than cuts. That would be a fundamentally different market regime than what most participants are positioned for. Labor data and CPI prints over the next 60 days are the key catalyst calendar items.
- Defense sector positioning: In geopolitical disruption cycles, defense spending accelerates. US defense budgets were already expanding heading into 2026. European NATO members accelerating their own defense CapEx adds another demand layer for defense primes. Industrials with defense exposure — broadly outperforming in 2026 — deserve attention as a hedge within the portfolio, not just a directional bet.
- Helium and semiconductor supply chain risk: This is the sleeper risk. TSM’s helium reserves are finite. If Q3 supply chains begin signaling GPU production constraints due to helium shortages, the AI infrastructure trade — which has been running largely unchallenged — faces an unexpected headwind. Monitor this quietly.
The part people skip in these environments: liquidity. When macro uncertainty is elevated, bid-ask spreads widen, market depth thins, and position exits become harder and more costly than entries. Sizing positions with that in mind — particularly in commodity-linked names with high short interest — is not optionality, it’s risk management.
The Strategic Picture
Here’s where I keep landing. The 2026 setup was already complicated before February — tariff-driven inflation, a Fed that couldn’t cut as fast as the market wanted, stretched valuations in mega-cap tech, and a midterm election year that historically produces the weakest returns of the four-year presidential cycle. The Hormuz closure didn’t create fragility. It revealed it.
What the IEA is calling the greatest global energy security challenge in history isn’t something markets can absorb quietly and move on from in a quarter. The physical market dislocations — $150 physical crude, all-time high distillate prices in Singapore at above $290/bbl, LNG global supply down 20%, a 40–120% consumer price spike in Gulf states — these are not headline numbers. They’re supply chain realities that will show up in corporate cost structures with a 2–3 quarter lag.
The question for active traders isn’t whether to position for this. You already are, passively, through equity exposure. The question is whether you’re positioned intentionally — with a view on duration, scenario probability, and sector allocation that reflects what’s actually happening in the physical world — or whether you’re watching it play out reactively.
Preparation beats prediction. The traders who did well in Q1 2026 weren’t necessarily the ones who called the war. They were the ones who understood how energy supply shocks transmit through sectors, and sized accordingly before the data was obvious.
The next phase of this trade is still being written.
For informational and educational purposes only. Not investment advice. Trading involves risk, including loss of principal.